
|
latest version v1.9 - last update 10 Apr 2010 |
|
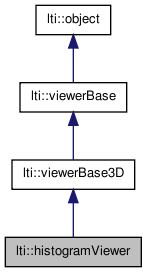
This class display the histograms of images or channels. More...
#include <ltiHistogramViewer.h>


Classes | |
| class | configDialog |
| GTK Widget for the configuration dialog of the histogram viewer. More... | |
| class | mainWindow |
| GTK Widget for the main class of the histogram viewer. More... | |
| class | parameters |
| the parameters for the class viewerBase3D More... | |
Public Member Functions | |
| histogramViewer (bool createDefaultParameters=true) | |
| histogramViewer (const histogramViewer &other) | |
| histogramViewer (const std::string &title) | |
| histogramViewer (const char *title) | |
| virtual | ~histogramViewer () |
| virtual const char * | getTypeName () const |
| histogramViewer & | copy (const histogramViewer &other) |
| histogramViewer & | operator= (const histogramViewer &other) |
| virtual viewerBase * | clone () const |
| const parameters & | getParameters () const |
| virtual bool | show (const image &data) |
| virtual bool | show (const channel8 &data) |
| virtual bool | show (const channel &data) |
| virtual bool | show (const matrix< float > &data) |
| virtual bool | show (const matrix< double > &data) |
| virtual bool | show (const matrix< int > &data) |
| virtual bool | show (const vector< double > &data) |
| virtual bool | show (const vector< float > &data) |
| virtual bool | show (const vector< int > &data) |
| virtual bool | show (const thistogram< double > &data) |
Protected Member Functions | |
| virtual viewerBase3D::mainWindow * | getNewMainWindow () const |
Protected Attributes | |
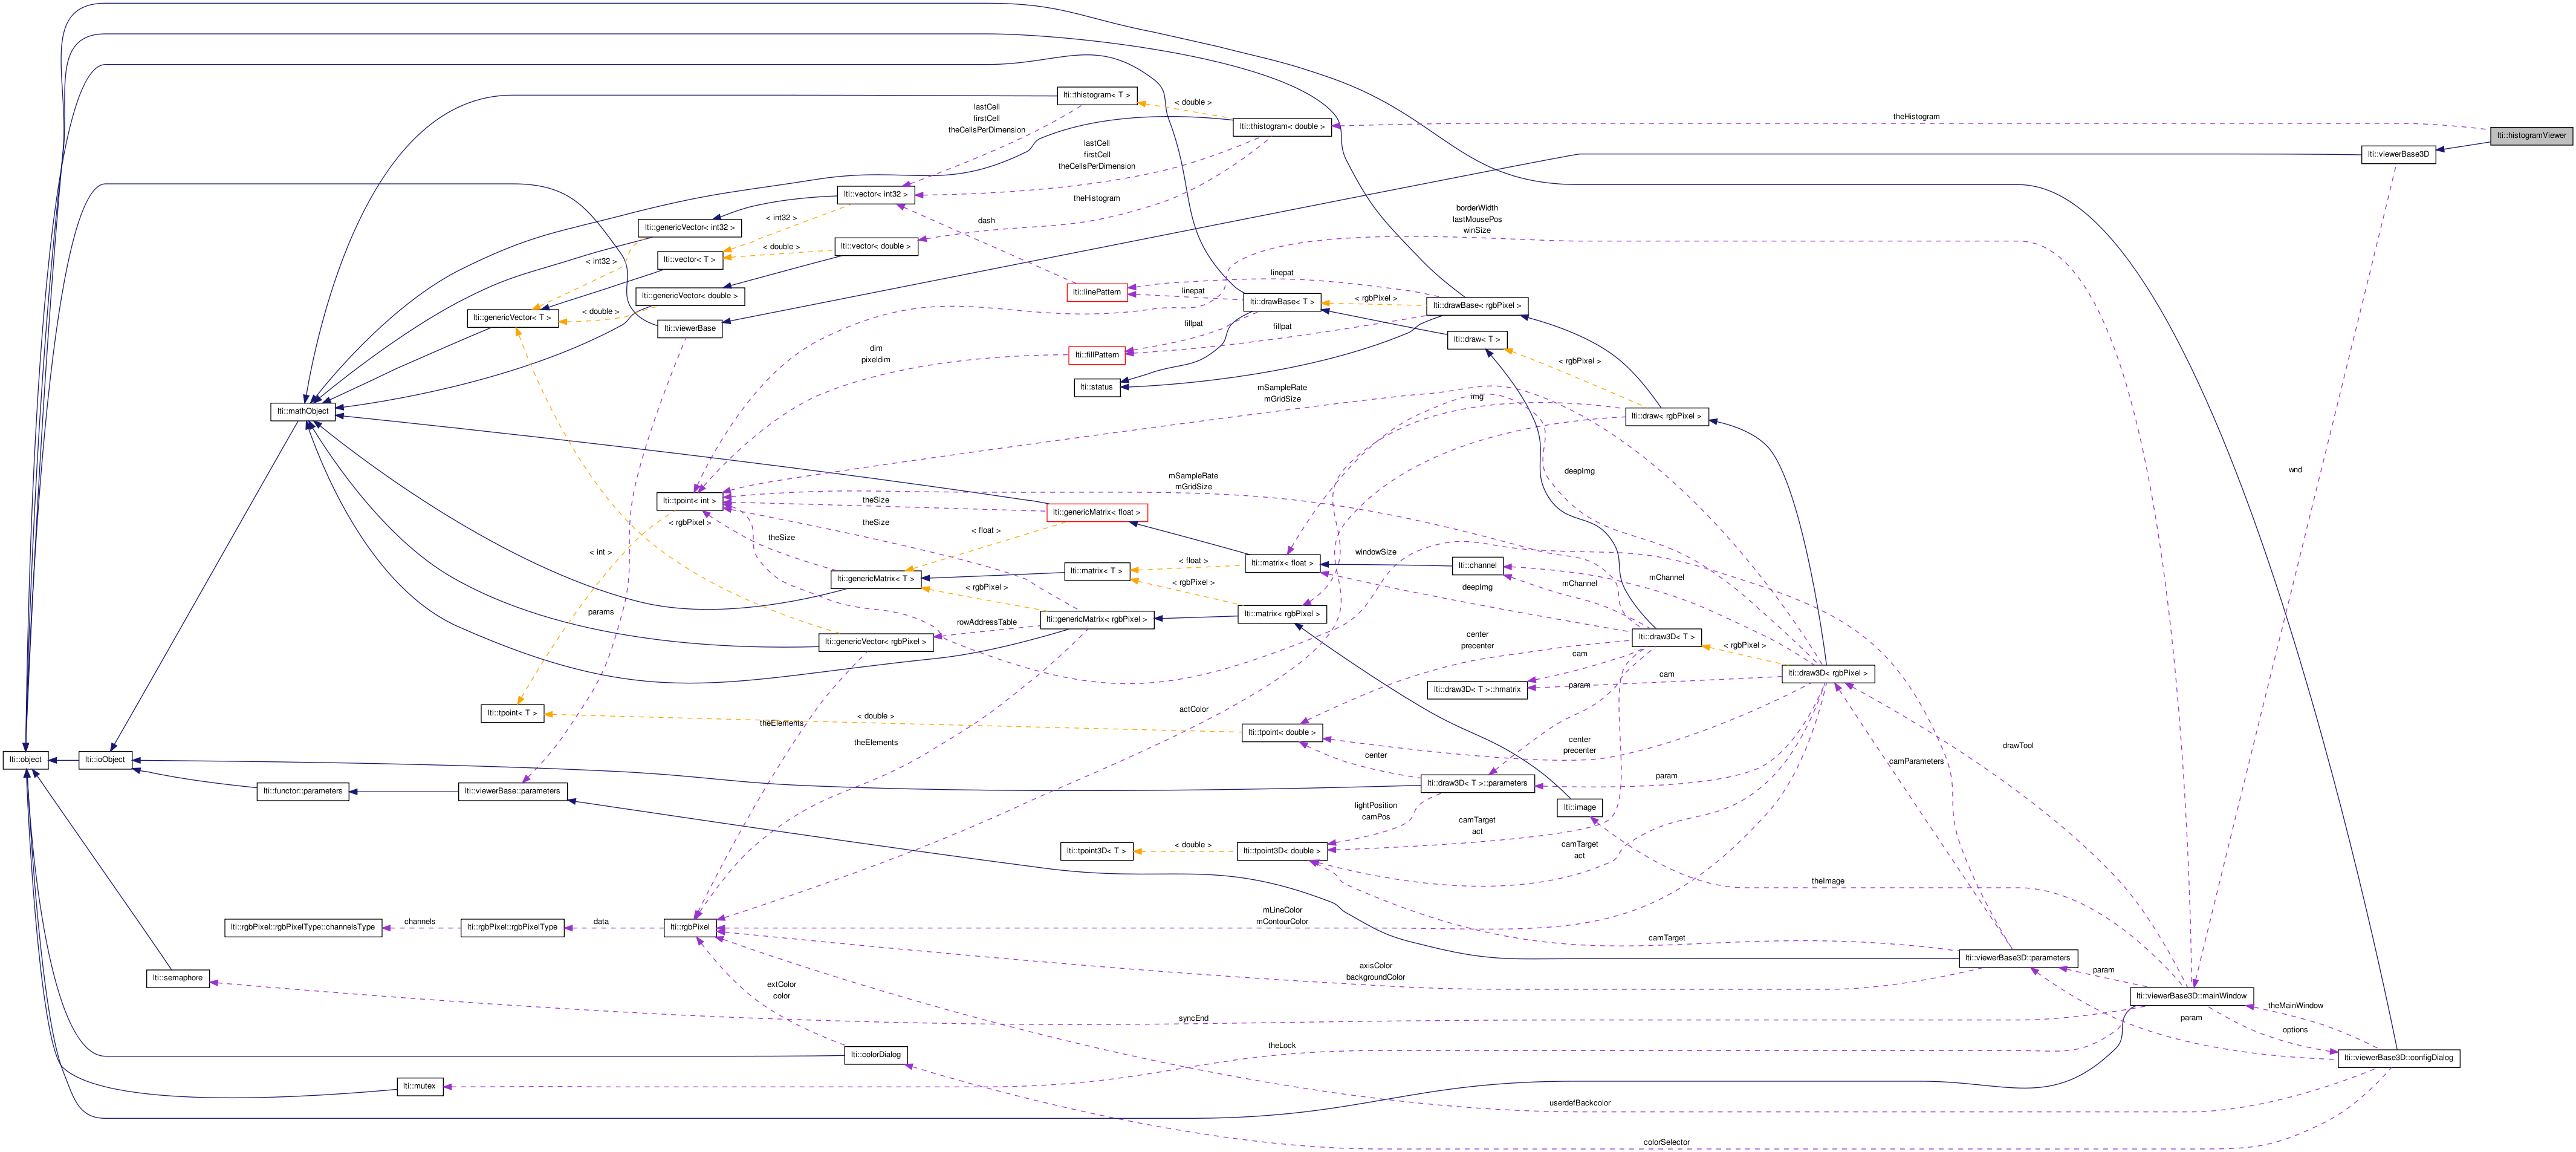
| thistogram< double > | theHistogram |
This class display the histograms of images or channels.
Histograms can also be given directly (1D, 2D or 3D).
| lti::histogramViewer::histogramViewer | ( | bool | createDefaultParameters = true |
) |
default constructor
| lti::histogramViewer::histogramViewer | ( | const histogramViewer & | other | ) |
copy constructor
| other | the object to be copied |
| lti::histogramViewer::histogramViewer | ( | const std::string & | title | ) |
constructor with windows title
| lti::histogramViewer::histogramViewer | ( | const char * | title | ) |
constructor with windows title
| virtual lti::histogramViewer::~histogramViewer | ( | ) | [virtual] |
destructor
| virtual viewerBase* lti::histogramViewer::clone | ( | ) | const [virtual] |
returns a pointer to a clone of this functor.
Reimplemented from lti::viewerBase3D.
| histogramViewer& lti::histogramViewer::copy | ( | const histogramViewer & | other | ) |
copy data of "other" functor.
| other | the functor to be copied |
Reimplemented from lti::viewerBase3D.
| virtual viewerBase3D::mainWindow* lti::histogramViewer::getNewMainWindow | ( | ) | const [protected, virtual] |
return a new instance of the mainWindow class.
This class must be reimplemented in order to get the proper class instance.
Reimplemented from lti::viewerBase3D.
| const parameters& lti::histogramViewer::getParameters | ( | ) | const |
returns used parameters
Reimplemented from lti::viewerBase3D.
| virtual const char* lti::histogramViewer::getTypeName | ( | ) | const [virtual] |
returns the name of this type ("histogramViewer")
Reimplemented from lti::viewerBase3D.
| histogramViewer& lti::histogramViewer::operator= | ( | const histogramViewer & | other | ) |
alias for copy member
| other | the functor to be copied |
Reimplemented from lti::viewerBase3D.
| virtual bool lti::histogramViewer::show | ( | const thistogram< double > & | data | ) | [virtual] |
shows the given histogram.
Please note that the lti::viewer is faster displaying one-dimensional histograms.
| data | the object to be shown. |
| virtual bool lti::histogramViewer::show | ( | const vector< int > & | data | ) | [virtual] |
compute a 1D histogram for the values in the vector, where the number of bins per dimension is taken from the parameters' attribute cells.
The value-axis covers the entire value range found in the channel divided by the corresponding number of cells. (x component).
Please note that the lti::viewer is faster displaying vectors.
shows a vector of double
| data | the object to be shown. |
Reimplemented from lti::viewerBase3D.
| virtual bool lti::histogramViewer::show | ( | const vector< float > & | data | ) | [virtual] |
compute a 1D histogram for the values in the vector, where the number of bins per dimension is taken from the parameters' attribute cells.
The value-axis covers the entire value range found in the channel divided by the corresponding number of cells. (x component).
Please note that the lti::viewer is faster displaying vectors.
shows a vector of double
| data | the object to be shown. |
Reimplemented from lti::viewerBase3D.
| virtual bool lti::histogramViewer::show | ( | const vector< double > & | data | ) | [virtual] |
compute a 1D histogram for the values in the vector, where the number of bins per dimension is taken from the parameters' attribute cells.
The value-axis covers the entire value range found in the channel divided by the corresponding number of cells. (x component).
Please note that the lti::viewer is faster displaying vectors.
shows a vector of double
| data | the object to be shown. |
Reimplemented from lti::viewerBase3D.
| virtual bool lti::histogramViewer::show | ( | const matrix< int > & | data | ) | [virtual] |
compute a 1D histogram for the matrix, where the number of bins per dimension is taken from the parameters' attribute cells.
The value-axis covers the entire value range found in the matrix divided by the corresponding number of cells. (x component).
| data | matrix, which histogram will be displayed. |
Reimplemented from lti::viewerBase3D.
| virtual bool lti::histogramViewer::show | ( | const matrix< double > & | data | ) | [virtual] |
compute a 1D histogram for the matrix, where the number of bins per dimension is taken from the parameters' attribute cells.
The value-axis covers the entire value range found in the matrix divided by the corresponding number of cells. (x component).
| data | matrix, which histogram will be displayed. |
Reimplemented from lti::viewerBase3D.
| virtual bool lti::histogramViewer::show | ( | const matrix< float > & | data | ) | [virtual] |
compute a 1D histogram for the matrix, where the number of bins per dimension is taken from the parameters' attribute cells.
The value-axis covers the entire value range found in the matrix divided by the corresponding number of cells. (x component).
Reimplemented from lti::viewerBase3D.
| virtual bool lti::histogramViewer::show | ( | const channel & | data | ) | [virtual] |
compute a 1D histogram for the channel, where the number of bins per dimension is taken from the parameters' attribute cells.
The value-axis covers the entire value range found in the channel divided by the corresponding number of cells. (x component).
| data | channel, which histogram will be displayed. |
Reimplemented from lti::viewerBase3D.
| virtual bool lti::histogramViewer::show | ( | const channel8 & | data | ) | [virtual] |
compute a 1D histogram for the channel8, where the number of bins is taken from the parameters' attribute cells.
The value-axis covers the entire ubyte value range from 0 to 255 divided by the corresponding number of cells. (x component).
| data | channel8, which histogram will be displayed. |
Reimplemented from lti::viewerBase3D.
| virtual bool lti::histogramViewer::show | ( | const image & | data | ) | [virtual] |
compute a 3D histogram for the image, where the numbers of bins per dimension are taken from the parameters' attribute cells.
Each dimension will cover the entire R,G, or B color component from 0 to 255 divided by the corresponding number of cells. (x for red, y for green and z for blue).
The value in the cell will be displayed as a gray level, with white assigned to the highest value in the histogram and black to the lowest, or, in a color cloud where each cell-box will have the corresponding color of the color space, and will be display if its value is greater that a threshold given through the parameter binThreshold
| data | image, which histogram will be displayed. |
Reimplemented from lti::viewerBase3D.
thistogram<double> lti::histogramViewer::theHistogram [protected] |
the histogram being displayed