
|
latest version v1.9 - last update 10 Apr 2010 |
|
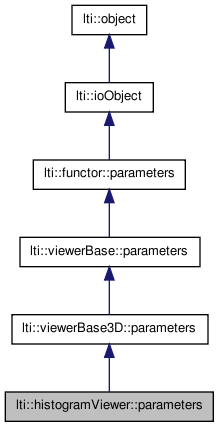
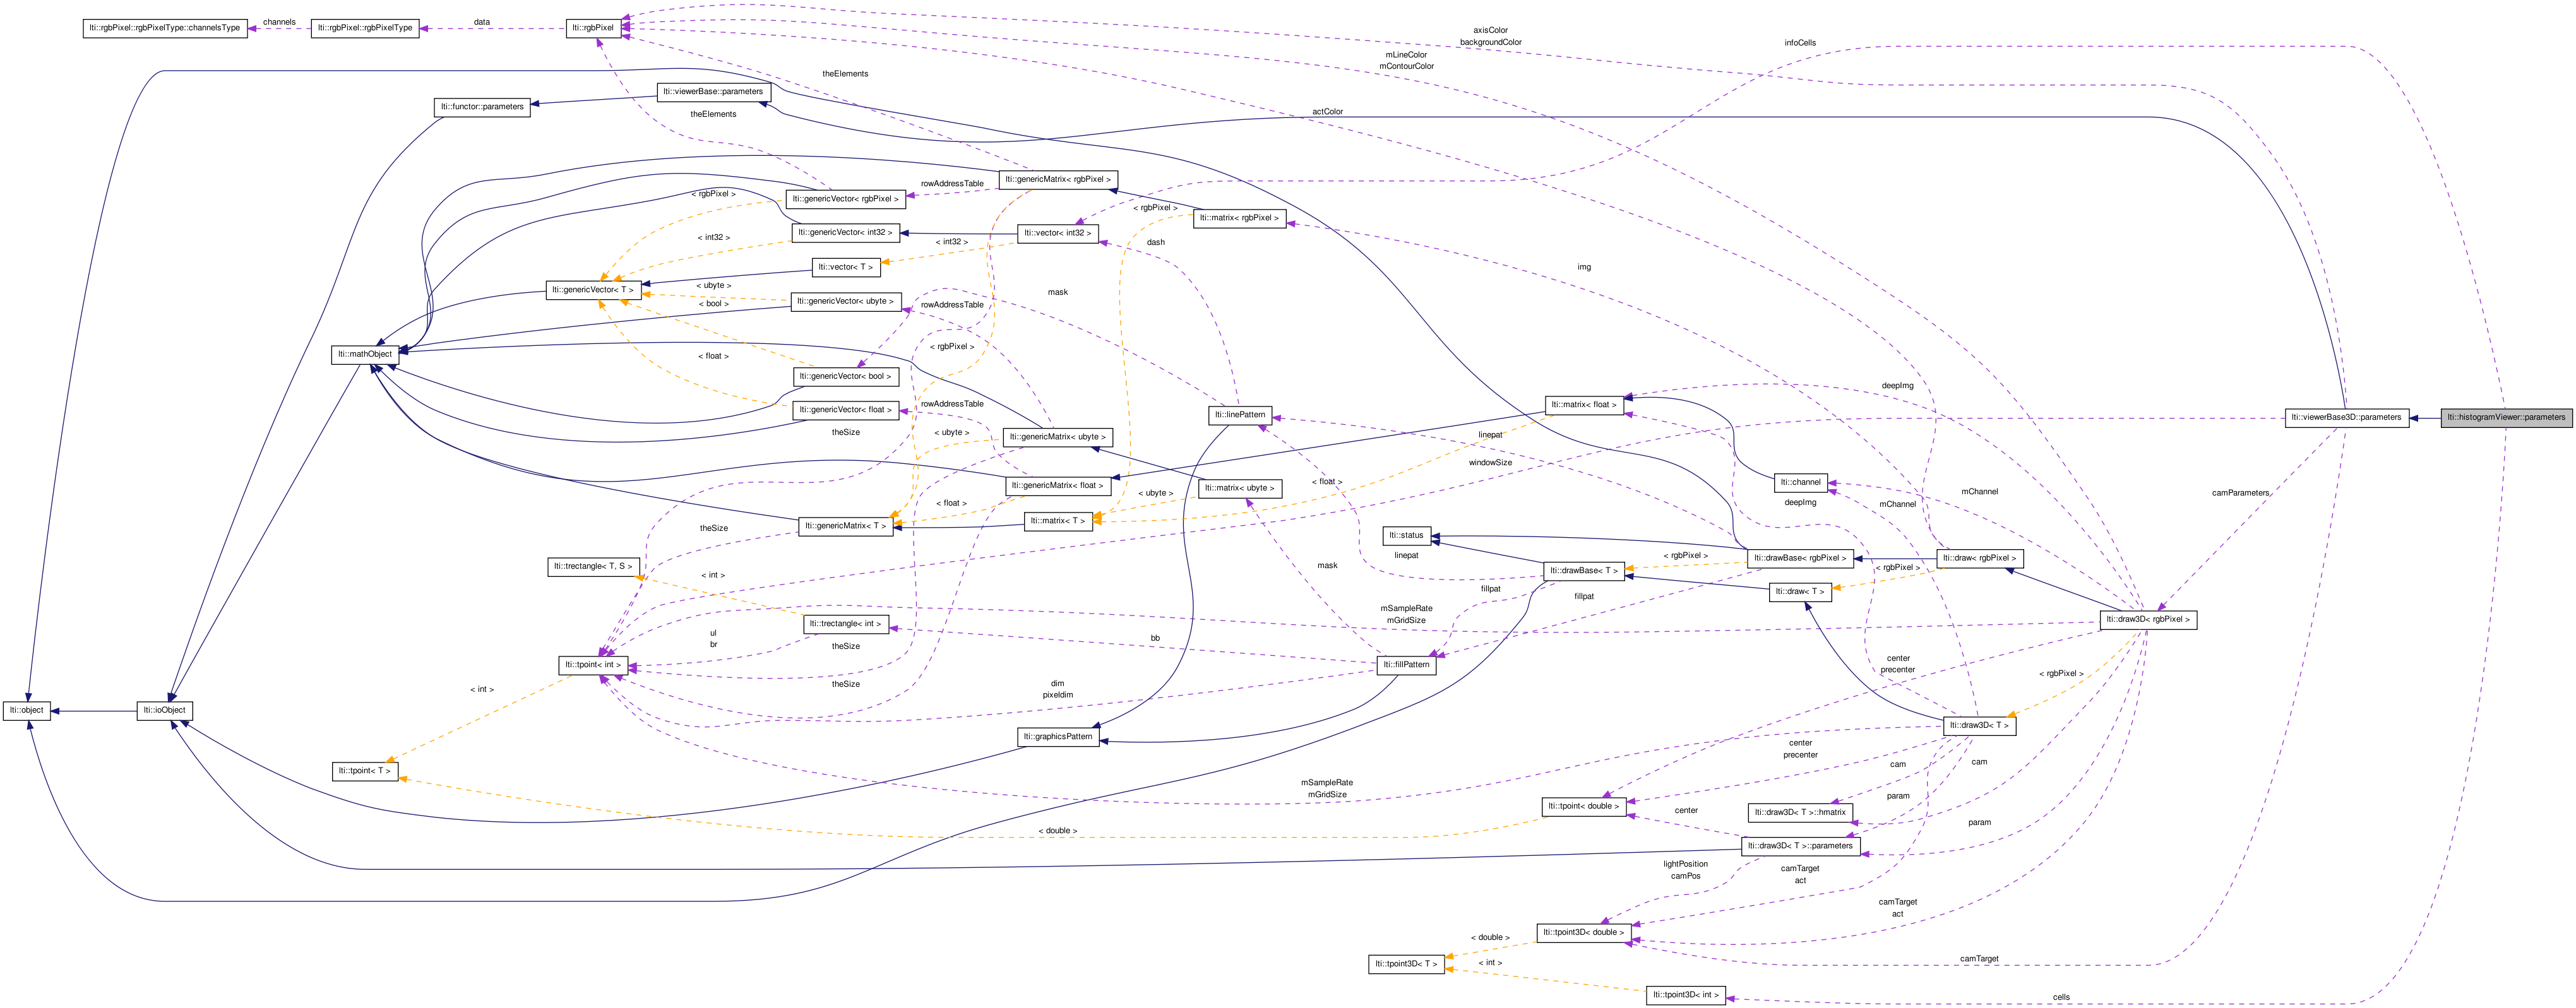
the parameters for the class viewerBase3D More...
#include <ltiHistogramViewer.h>


Public Member Functions | |
| parameters () | |
| parameters (const parameters &other) | |
| ~parameters () | |
| const char * | getTypeName () const |
| virtual parameters & | copy (const parameters &other) |
| virtual functor::parameters * | clone () const |
| virtual bool | write (ioHandler &handler, const bool complete=true) const |
| virtual bool | read (ioHandler &handler, const bool complete=true) |
Public Attributes | |
| tpoint3D< int > | cells |
| bool | useBoxes |
| bool | greyEntries |
| bool | useLines |
| double | binThreshold |
Info fields | |
The following attributes are not viewer parameters, but are required to give some information to the configuration dialog. This can change in the feature (enclosed in a new class, for example). The values you write here will be ignored. | |
| double | infoMaxEntry |
| double | infoNumEntries |
| ivector | infoCells |
the parameters for the class viewerBase3D
| lti::histogramViewer::parameters::parameters | ( | ) |
default constructor
Reimplemented from lti::viewerBase3D::parameters.
| lti::histogramViewer::parameters::parameters | ( | const parameters & | other | ) |
copy constructor
| other | the parameters object to be copied |
Reimplemented from lti::viewerBase::parameters.
| lti::histogramViewer::parameters::~parameters | ( | ) | [virtual] |
destructor
Reimplemented from lti::viewerBase3D::parameters.
| virtual functor::parameters* lti::histogramViewer::parameters::clone | ( | ) | const [virtual] |
returns a pointer to a clone of the parameters
Reimplemented from lti::viewerBase3D::parameters.
| virtual parameters& lti::histogramViewer::parameters::copy | ( | const parameters & | other | ) | [virtual] |
copy the contents of a parameters object
| other | the parameters object to be copied |
Reimplemented from lti::viewerBase::parameters.
| const char* lti::histogramViewer::parameters::getTypeName | ( | ) | const [virtual] |
returns name of this type
Reimplemented from lti::viewerBase3D::parameters.
| virtual bool lti::histogramViewer::parameters::read | ( | ioHandler & | handler, | |
| const bool | complete = true | |||
| ) | [virtual] |
read the parameters from the given ioHandler
| handler | the ioHandler to be used | |
| complete | if true (the default) the enclosing begin/end will be also written, otherwise only the data block will be written. |
Reimplemented from lti::viewerBase3D::parameters.
| virtual bool lti::histogramViewer::parameters::write | ( | ioHandler & | handler, | |
| const bool | complete = true | |||
| ) | const [virtual] |
write the parameters in the given ioHandler
| handler | the ioHandler to be used | |
| complete | if true (the default) the enclosing begin/end will be also written, otherwise only the data block will be written. |
Reimplemented from lti::viewerBase3D::parameters.
an entry in the histogram must have a value greater than this threshold multiplied with the maximum entry value in order to be displayed.
Valid values are between 0 and 1.
Default: 0.0
Number of cells (or bins) per dimension for the histograms created.
For the one dimensional case, only the x attribute will be considered. In the two dimesional case x and y are important, and in the three dimensional case all attributes are relevant.
Note that this parameter is ignored for the show method that directly receives a histogram, where it intrinsically defines the number of bins per dimension.
Default: tpoint3D<int>(32,32,32)
Flag to specify if the "color" of the point/box should represent the entry value in the corresponding histogram cell.
If true, a grey value will be used to represent the value. White will be the highest value in the histogram and Black will represent the cells with zero entries. (see also binThreshold)
If false, the color for the cell will be determined with the indices of each cell, assuming that the first element of the index correponds with red, the second with green and the third with blue. This is used to display the "color clouds" of images.
Default value: false
dimensions and bins of the histogram
maximal entry value of histogram being displayed
number of entries in the histogram
Used to specify if the cells should be represented with boxes or with points.
If false, points will represent each cell:
  |
  |           .
  |           |
  |        .  |           .
  |        |  |     .     |
  |  .     |  |  .  |     |
  |  |  .  |  |  |  |  .  |
  .  |  |  |  |  |  |  |  |
  |__|__|__|__|__|__|__|__|____
If true, boxes will be used:
  |
  |           .__
  |           |  |
  |        .__|  |        .__
  |        |  |  |  .__   |  |
  |  .__   |  |  .__|  |  |  |
  |  |  .__|  |  |  |  .__|  |
  .__|  |  |  |  |  |  |  |  |
  |__|__|__|__|__|__|__|__|__|_
Default value: true (i.e. boxes will be displayed)
show the lines in case of 2D and 1D histograms to denote the boundaries of the cells:
If true, (and with boxes=false) the result will be like the one on the left side.
  |                               |
  |           .                   |           .
  |           |                   |
  |        .  |           .       |        .              .
  |        |  |     .     |       |                 .
  |  .     |  |  .  |     |       |  .           .
  |  |  .  |  |  |  |  .  |       |     .              .
  .  |  |  |  |  |  |  |  |       .
  |__|__|__|__|__|__|__|__|____   |____________________________
Default value: false;