
|
latest version v1.9 - last update 10 Apr 2010 |
|
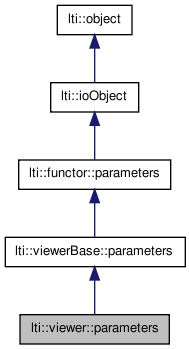
The parameters for the class viewer. More...
#include <ltiViewer.h>


The parameters for the class viewer.
These parameters control the way an image or channel is displayed. You can also use them to generate with the lti::viewerFunctor images as shown by the lti::viewer.
| lti::viewer::parameters::parameters | ( | ) |
default constructor
Reimplemented from lti::viewerBase::parameters.
| lti::viewer::parameters::parameters | ( | const parameters & | other | ) |
copy constructor
Reimplemented from lti::viewerBase::parameters.
| virtual lti::viewer::parameters::~parameters | ( | ) | [virtual] |
destructor
Reimplemented from lti::viewerBase::parameters.
| virtual functor::parameters* lti::viewer::parameters::clone | ( | ) | const [virtual] |
returns a pointer to a clone of the parameters
Reimplemented from lti::viewerBase::parameters.
| parameters& lti::viewer::parameters::copy | ( | const parameters & | other | ) |
copy member
Reimplemented from lti::viewerBase::parameters.
| const char* lti::viewer::parameters::getTypeName | ( | ) | const [virtual] |
returns name of this type
Reimplemented from lti::viewerBase::parameters.
| parameters& lti::viewer::parameters::operator= | ( | const parameters & | other | ) |
copy data of "other" parameters
Reimplemented from lti::viewerBase::parameters.
| virtual bool lti::viewer::parameters::read | ( | ioHandler & | handler, | |
| const bool | complete = true | |||
| ) | [virtual] |
read the parameters from the given ioHandler
| handler | the ioHandler to be used | |
| complete | if true (the default) the enclosing begin/end will be also written, otherwise only the data block will be written. |
Reimplemented from lti::viewerBase::parameters.
| virtual bool lti::viewer::parameters::write | ( | ioHandler & | handler, | |
| const bool | complete = true | |||
| ) | const [virtual] |
write the parameters in the given ioHandler
| handler | the ioHandler to be used | |
| complete | if true (the default) the enclosing begin/end will be also written, otherwise only the data block will be written. |
Reimplemented from lti::viewerBase::parameters.
intensity average
RGB average.
Parameter to control the constrast of the displayed image.
Default value: 1.0
Show axis.
If true, the horizontal axis (value 0) will be drawn using the color given in underflowColor.
Default value: true
Show mean values.
If true, the mean value of the elements and the mean value of the indices will be drawn using the color given by overflowColor
Default value: false
for integer images, consider them as a label-mask and use only a few colors to appreciate the different labeled regions in a better way.
Default value: false
maximum intensity value
maximum RGB components
minimum intensity value
minimum RGB components
If labelAdjacencyMap is true, indicate if an 8-Neighborhood (true) or a 4-Neighborhood (false) between the regions exist.
Default value: 4-Neighborhood (i.e. false);
color of the overflow values.
For vectors and 1D histograms, this is used to draw the mean value of the elements and the mean index value.
The default is Yellow
Number of pixels per element or per histogram bin used.
Default value: 1 pixel
if showHex is true, then the RGB value will be displayed in hex.
Default value: false
standard deviation
color of the underflow values.
For vectors and 1D histograms, this is used as the axis color.
The default is Blue
Used to specify if the elements of the vector or bins of histogram1D s should be represented with boxes or with points.
If false, points will represent each cell:
  |
  |           .
  |           |
  |        .  |           .
  |        |  |     .     |
  |  .     |  |  .  |     |
  |  |  .  |  |  |  |  .  |
  .  |  |  |  |  |  |  |  |
  |__|__|__|__|__|__|__|__|____
If true, boxes will be used:
  |
  |           .__
  |           |  |
  |        .__|  |        .__
  |        |  |  |  .__   |  |
  |  .__   |  |  .__|  |  |  |
  |  |  .__|  |  |  |  .__|  |
  .__|  |  |  |  |  |  |  |  |
  |__|__|__|__|__|__|__|__|__|_
Default value: true (i.e. boxes will be displayed)
If labelAdjacencyMap is true, indicate if all colors in the user defined palette should be used or only the first ones.
Default value: false (i.e. use all colors in the palette if possible)
show the lines between the coordinate system and the points should be drawn.
If true, (and with useBoxes=false) the result will be like the one on the left side.
  |                               |
  |           .                   |           .
  |           |                   |
  |        .  |           .       |        .              .
  |        |  |     .     |       |                 .
  |  .     |  |  .  |     |       |  .           .
  |  |  .  |  |  |  |  .  |       |     .              .
  .  |  |  |  |  |  |  |  |       .
  |__|__|__|__|__|__|__|__|____   |____________________________
Default value: false
Number of pixels used at the y-coordinate of the vector or histogram1D representation.
Default value: 256
Which palette should be used?
Default value: Gray
zoom factor of the window.
The scale factor is 2^zoomFactor. Only values between -4 and 4 are valid.
Default value: 0